Australia - 'Time to Reply' Fitness Industry Study
202 Email + 338 social media membership enquiries were sent to Australian fitness operators. Matt McCallum, Keepme's Growth Marketing expert dives into what we learned...


Unveiling the Realities of Gym Response Times in Australia: A Wake-Up Call to Fitness Operators
Australian Fitness Facilities are failing when it comes to member acquisition, due to what must surely appear to the consumer as a lack of effort when it comes to simple membership inquiries.
Our newest 'Time to Reply' study uncovered a worrying percentage of membership inquiries are going completely unanswered - over 18% of emails, 26% of Instagram messages, and 33% of Facebook messages received no reply at all.
PLUS, the speed at which these responses were received also raised major red flags, with email inquiries taking an average of 7.5 hours to elicit a reply, Facebook lagging at 19 hours, and Instagram trailing even further at a whopping 31 hours.
Going one step further, we dove head-first into the quality of the responses received. Alarmingly, a significant portion of replies - 28% for emails and 37% for social media - failed to answer the simple membership-pricing-based question, further undermining the effectiveness and revenue potential of these interactions.
Get Access To The Ungated Report 👉
For an industry where competition is undeniably fierce and the window to convert interest into action increasingly narrow, these figures suggest a huge opportunity for proactive operators to capitalize and skyrocket their lead generation.
Having conducted the same studies in the UK and North America, we wanted to determine the state of play in Australia too. As such, in this iteration of the study we set out to answer the following questions:
How many clubs typically respond to membership inquiries with 'real', non-automated responses?
How appropriate and engaging are the responses given?
What are the average response times for those replies?
What opportunities are missed due to slow response times?
And how could you improve your ‘speed to lead’?
Australia 'Time To Reply' Study Highlights
In August 2024 we sent 202 emails, 174 Instagram messages, and 164 Facebook messages to health and fitness clubs across Australia. Before we get into the finer details of the study for each of the 4 segments evaluated, here are the overall highlights.
LEAD GEN PILLAR 1: Certainty of Reply
With over 18% of email, 26% of Instagram, and 33% of Facebook inquiries going unanswered, 'certainty' does not feel appropriate for any channel. Even as the best performer amongst these at 18% unanswered, email still fell short of what feels like an acceptable KPI for the response rate to prospective members.
LEAD GEN PILLAR 2: Speed To Reply
Email inquiries took nearly 7.5 hours to receive a response, while Facebook messages lagged with an average reply time of 19 hours. Instagram inquiries fared even worse, with prospects waiting an average of 31 hours for a response. These delays are far from ‘quick,’ and in some cases, they render the responses given a waste of time, with prospects likely already moved on to an alternative target.
- 18.32%
- Didn't reply to email enquiries
- 449.76
- Avg email response time (mins)
FACEBOOK & INSTAGRAM
- 33.54%
- Did not respond to Facebook enquiries
- 1147.07
- Avg Facebook response time (mins)
- 26.44%
- Did not respond to Instagram enquiries
- 1884.88
- Avg Instagram response time (mins)
LEAD GEN PILLAR 3: Quality of Response
In a large sample taken from those emails that received a response, over 28% did not answer the question asked in the inquiry. This rose to 37% in the social media replies. Of those who did answer the question, only 31% mentioned booking a facility tour, trial, or visit.
Given how critical these aspects of the member acquisition process are, it’s evident that slow responses, lack of follow-up, or poor-quality replies are significantly hindering membership sales in Australia.
When considering consumers' expectations of personalized replies in any B2C context, the quality of fitness inquiry responses witnessed adds a crucial layer of complexity.
Here's an example of a real reply received to give you a taste of where this is going...
"Even if a fitness club manages to respond to every inquiry within five minutes, the benefits of such promptness can quickly be negated by poor-quality replies - whether due to insufficient information, an inappropriate tone, or the absence of a clear call to action, such as encouraging the next step with a tour or trial offer."

The quality of 'real replies' we collated was wrought with inconsistencies in structure, varying levels of detail, and a concerning lack of clear calls to action. Even in email, the channel that seems to receive the most attention, 40% of replies failed to give a complete answer to the question asked.
Now let's take a closer look at some of the responses across various channels to highlight the spectrum of quality and identify areas where improvements are needed.
We'll start with a strong example, demonstrating our faith in the frontline of fitness:
.png) This response to an Instagram membership inquiry is the kind of response we'd hope to see - it's personalized, directly answers the question and adds pertinent information, the language and tone are friendly, and it's action-oriented in that it aims to get to the next step - the tour booking. While we could offer some linguistic and marketing improvements that would make this the perfect answer, there's no question that this is the correct approach, and furthermore it arrived within one minute.
This response to an Instagram membership inquiry is the kind of response we'd hope to see - it's personalized, directly answers the question and adds pertinent information, the language and tone are friendly, and it's action-oriented in that it aims to get to the next step - the tour booking. While we could offer some linguistic and marketing improvements that would make this the perfect answer, there's no question that this is the correct approach, and furthermore it arrived within one minute.
Let's break it down a little further to show that while the capability exists, this is in no way a typical response. If we concentrate on those social media inquiries we have 235 messages to consider (a 69.5% response rate overall).
Of those 235, 146 (62.3%) directly answered the questions posed by responding about the joining fee and membership costs.
If we look to those 146, only 45 (31%) of this narrowing group went as far as our example above, and suggested a visit or tour as the next step. Looking at these groups within groups is quickly becoming complicated though and we could subdivide all day. We're now left with 45 responses who answered the question and were action-biased out of 235 replies, or 19.1% of those who actually responded.
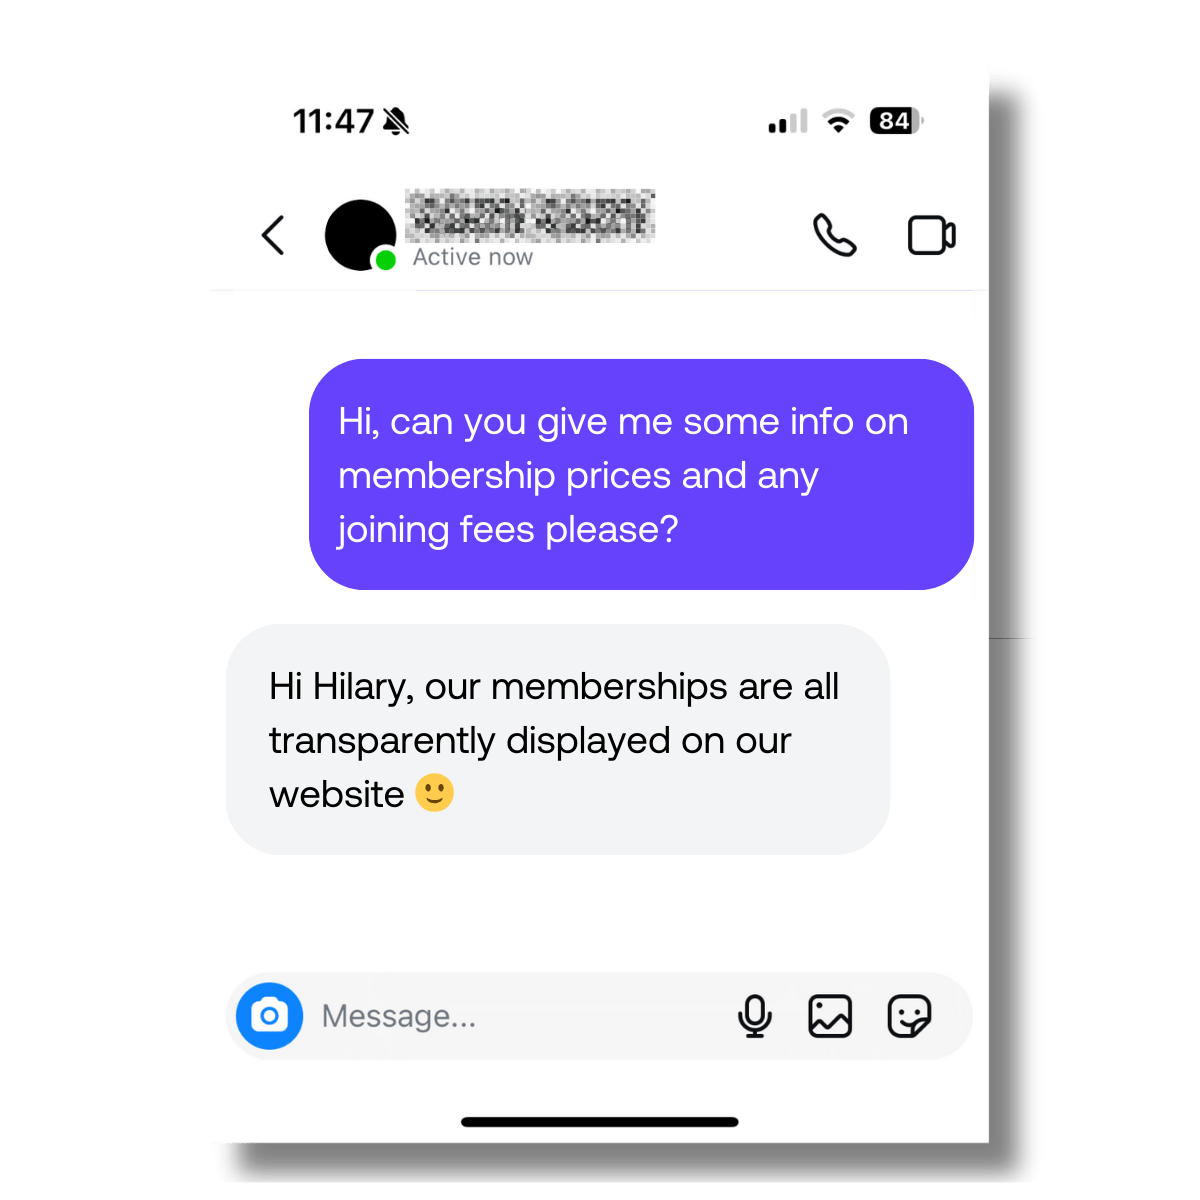
What then, do the rest of the replies look like? Thankfully the "our memberships are all transparently displayed on our website 🙂" isn't typical either, but it was by no means unique with a total of 4 replies directing prospective members to find the information without even including a link.
.png) We've seen the best of those who answered the question, and understand that while the pyramid of replies is topped by those who answered and sought action in the form of a tour booking, the base is made up of those who answered but did no more. In between we get variations on the theme of suggesting a phone call or sharing a link.
We've seen the best of those who answered the question, and understand that while the pyramid of replies is topped by those who answered and sought action in the form of a tour booking, the base is made up of those who answered but did no more. In between we get variations on the theme of suggesting a phone call or sharing a link.
We've seen also the worst of those who replied - those who failed to answer or provide any more help than pointing vaguely in the direction of the website.
What remains then is the balance of those 89 (37.45%) of operators who replied without an answer, but made some level of effort in between.
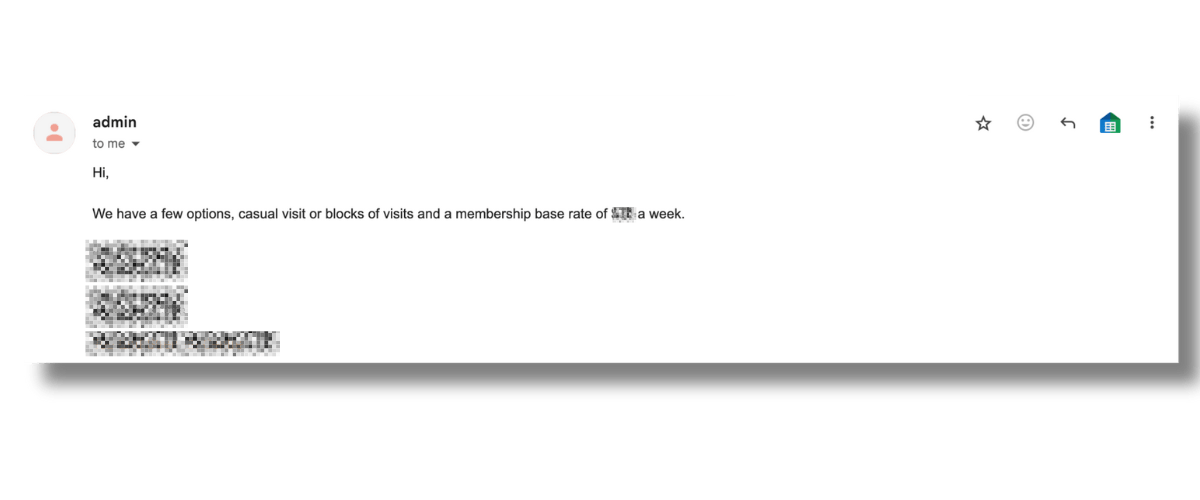
.png) This is clearly a step up from our worst examples in that it includes the URL, but while it's far from exemplary it represents 14% of the total replies received with 33 examples like this.
This is clearly a step up from our worst examples in that it includes the URL, but while it's far from exemplary it represents 14% of the total replies received with 33 examples like this.
The remainder - though unhelpful in that they don't supply the information requested, seem at least deliberate in their attempt to progress the communication, albeit via another channel:
.png) By attempting to engage with the inquiry on the gym's terms, instead of on the potential member's terms, 11.9% of those who replied employed the wrong strategy. By failing to respond 'where they are', and by not answering the question, they don't leave the prospect informed or a step closer to completing a desired action i.e. booking a tour or signing up.
By attempting to engage with the inquiry on the gym's terms, instead of on the potential member's terms, 11.9% of those who replied employed the wrong strategy. By failing to respond 'where they are', and by not answering the question, they don't leave the prospect informed or a step closer to completing a desired action i.e. booking a tour or signing up.
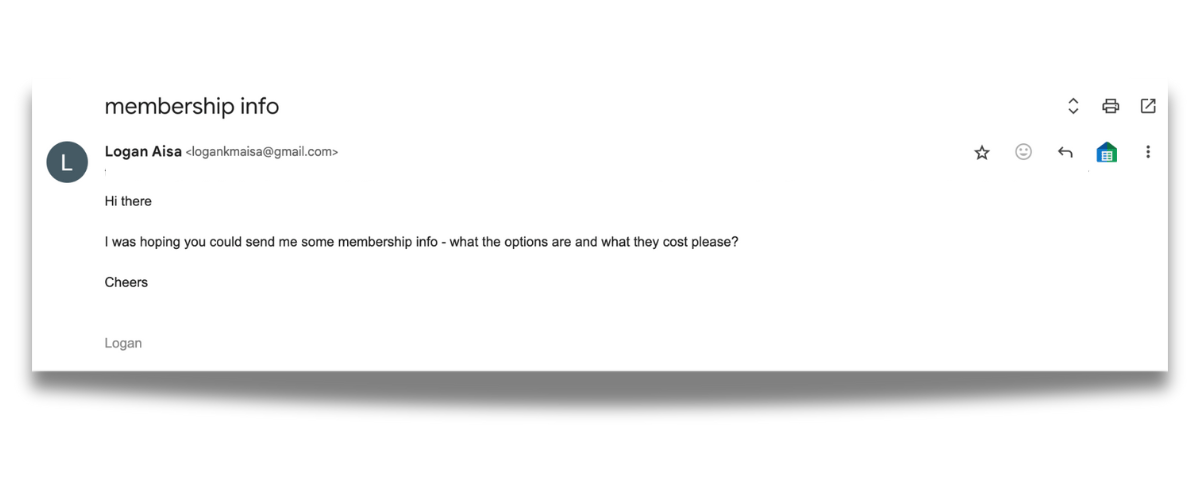
Email paints a very similar picture, with our tested sample (looking in depth at 98 of the replies) revealing a mixed quality of response. We'll start with a positive again though, with one of several examples we could have chosen to show us how it's done.
We've had to redact quite a lot of info (to protect the identity of the fitness brand), but that only confirms that the email was strong on branding and clear and specific language that showed a dedicated template was in use - providing the kind of consistency that would be easy to recognise. Suffice to say, the email went on to include everything that was asked, plus additional relevant information, a proper invitation to a tour, and all was delivered in friendly professional language.
However, as we saw with social media replies - the best answer is not necessarily the typical answer. While 60% of emails did answer what was asked, this again includes a spectrum of replies from the above, to those which answered the question and no more.
 With this response we can measure the time and even interpret this as an answer to our request for info, but given the endless possibilities email brings this is an incredibly lacklustre response.
.png) 8% of replies directed our inquiry to the website, with no further action or attempts to engage. What's most interesting about this is that one such reply came from one of the large chain clubs, while another venue from the same chain set a frankly exemplary response, demonstrating that even with the right strategy in place, there remains plenty of opportunity to get it wrong.
8% of replies directed our inquiry to the website, with no further action or attempts to engage. What's most interesting about this is that one such reply came from one of the large chain clubs, while another venue from the same chain set a frankly exemplary response, demonstrating that even with the right strategy in place, there remains plenty of opportunity to get it wrong.
.png) Finally then, in these last two examples we see the push to engage further, but without having answered the question, and failing to reply to the potential member 'where they are'. This was the case for a staggering 20% of email replies in the sample.
Finally then, in these last two examples we see the push to engage further, but without having answered the question, and failing to reply to the potential member 'where they are'. This was the case for a staggering 20% of email replies in the sample.
With almost 82% of emails receiving a reply, the first obvious opportunity would be the 18.3% who received no response. However having looked more closely at the quality of the responses, we see:
40% of these did not receive a full answer to their inquiry
Half of these non-answering replies, (20% of the sample) sought to move the conversation to a different channel
Those that did answer did so with a broad spectrum of quality
As we can see, the quality of responses often hinges on the level of attention that the assigned staff member can provide. To be fair, this is an industry built on human interaction, and team members frequently juggle multiple responsibilities. However, prospective members are unlikely to be as understanding. For them, the response they receive is often their first impression of the facility, making it a critical opportunity to enhance their likelihood of joining. This initial interaction not only sets the tone for their experience but also represents the most cost-effective chance to convert them into members.
On the surface, improving response quality seems straightforward. Given the importance of these interactions, it would be natural to implement a rigorous process as part of a well-defined strategy, which might include:
• Tightly scripted or checklist responses to ensure consistency.
• Easily accessible assets such as PDFs detailing membership fees, opening hours, and class schedules.
• Membership KPIs across inquiry channels, tracking key metrics like response times, tours booked, and membership sales.
• Automated email sequences designed to nurture colder leads and keep prospects engaged.
However, our findings suggest that KPIs for response quality are not widely adopted or at the very least we can assume that sales and marketing teams lack the necessary resources to empower them to deliver replies at a high enough standard, within the optimal 5-minute conversion golden window.
Australian Study Segmentation & Analysis
The Australian fitness industry segments we targeted were as follows:
N.B The study Methodology is available at the end of the article.
What's common across all the segments we studied is the following:
Responding to email gets top priority with the best response rate 81.68%, the shortest average response time at 449.76, and the best rate of response within 24 hours (87.88%) and 48 hours (97.58%).
Responding to Facebook comes next in terms of speed to reply at 1147.07 minutes, but fares less well when it comes to the need to reply, with 33.54% of our inquiries going unanswered.
Instagram then obviously flips this around with a slightly more respectable 26.44% of our messages never receiving a reply, but with those replies we did get arriving at a glacial average response time of 1884.88 minutes.
Let's consider this in terms of optimizing member acquisition, and we'll do so with a statistic that creates a great starting point. The 'golden window' we will refer to througout this study is based on the fact that leads which receive a response within 5 minutes are 100x more likely to ‘connect’ and converse with you, and 21x more likely to convert into genuine opportunities. The harsh reality then, is that we know even the 'best' numbers recorded still demonstrate a lot of room for improvement.
If email is considered the ‘winning’ channel, it’s concerning that over 18% of inquiries received no response, and 28% of sampled responses failed to address the question asked. Moreover, the average reply time was still a lengthy 7.5 hours - far exceeding the 5-minute target operators should be striving for. The fact that email is the best-performing channel suggests that this level of performance is either mistakenly accepted as adequate within the industry or reflects the best possible outcome given the resources currently allocated to the task. This highlights a significant opportunity for improvement in how operators approach and prioritize response times and quality.
Consider then the outliers - their performance and the advantage delivered...
5.05% of Franchise / Corporate Chains did respond to email inquiries within the first 5 minutes - those responses create an informed prospect, more likely to attend a tour, more likely to convert.
As we said above, 100x more likely to ‘connect’ and converse with you, and 21x more likely to convert into genuine opportunities. For this 5% of inquiries, the impact of these huge increases in the likelihood of connection and conversion translates directly into huge savings in cost per lead and cost per acquisition, and ultimately in profitability. What would it look like if the same level of impeccable service was applied to the 95% whose response took longer? What of the 18% who didn't get a reply? What if 100% of these inquiries were answered correctly and within 5 minutes?
And we've still only covered email. Facebook continues to be Australia's most used social media platform, with 78.2% of internet users aged 16 to 64 using it monthly. Facebook Messenger is crucial within the platform, capturing 69.9% of the demographic. Instagram is right behind, engaging the attention of 62.4% of users. And the facilities we tested know this - they're using these platforms with varying degrees of efficiency as we saw, but consider those numbers again:
Facebook
1147.07 minutes average reply time
33.54% of inquiries unanswered
Instagram
1884.88 minutes average reply time
26.44% of inquiries unanswered
The opportunity to capitalize on the gap between typical performance and optimal performance is huge.
The Segmented Results
Here are our findings for each of the individual segments in the study.
Aus Multi-Site Independents
- 7.14%
- Web Chat Availability %
- 74.07%
- % of Recipients Who Sent 'Real' Email Replies
- 25.93%
- % of Recipients Who Didn't Respond to Email
- 271.26
- Avg ‘speed to lead’ for 'real' email replies (mins)
- 86.96%
- % of Instagram Accounts That Sent 'Real' Replies
- 2562.2
- Avg ‘speed to lead’ for 'real' Instagram replies (mins)
- 47.62%
- % of Facebook Accounts That Sent 'Real' Replies
- 3318.63
- Avg ‘speed to lead’ for 'real' Facebook replies (mins)
Summary of Aus Multi-Site Performance
74.07% of Email Recipients sent a 'real' reply
25.93% of Email Recipients did not reply at all
5% of Email Recipients who responded did so within the 5 minute 'golden window'
10% of Email Recipients who responded did so within a 10 minute window
7.41%% Emails utilised an automated response
10% of Email Recipients who responded took more than 24 hours to respond
100% of Email Recipients who responded did so within 48 hours
-----------
47.62% of Facebook Recipients sent a 'real' reply
52.38% of Facebook Recipients did not reply at all
47.62%% Facebook messages utilised an automated response
20% of Facebook Recipients who responded did so within the 5 minute 'golden window'
20% of Facebook Recipients who responded did so within a 10 minute window
-----------
86.96% of Instagram Recipients sent a 'real' reply
13.04% of Instagram Recipients did not reply at all
30.43% Instagram messages utilised an automated response
15% of Instagram Recipients who responded did so within the 5 minute 'golden window'
25% of Instagram Recipients who responded did so within a 10 minute window
*The ‘golden window’ refers specifically to the immediate 5 minute period after an enquiry is sent
-----------
Over a quarter of Aus Multi-Site Independent email inquiries went unanswered (25.93%), the second highest percentage of the segments we tested and not indicative of 'certainty of reply'.
For those who did respond, only 5% replied within the 5-minute ‘golden window,’ and after a further 5 minutes responses had increased to just 10%. Given that only 7.4% of the Multi-Site Independents we enrolled in the test used an automated email response, the absence of real replies in the golden window was not mitigated by the automated replies. However, across the study as a whole, it's unfair to paint these results in too negative a light. Could they be better? Yes. However, in terms of email responses, Multi-Site Independents had the shortest overall average response time by a huge margin at 'only' 271 minutes, the highest rate of response within 24 hours at 90%, and all responses were sent within 48 hours.
On Facebook, over half of inquiries went unanswered with only 47.62% sending a real reply, and the same percentage (47.62%) received an automated reply. With half of these crossing over and receiving both, the automated responses do something to lessen the blow, but a full 28.57% still received neither a real nor automated response. It should also be noted that none of those auto-responses happened to include more than just a phone number or web address, and most contained nothing more than a 'thank you' for messaging.
20.00% managed to respond within 5 minutes, the best performance of all segments for this metric, though the number didn't increase when the window was expanded to 10 minutes. Interestingly while the percentage of responses within 5 minutes was markedly better than email performance, that improvement quickly vanished when overall average times were considered. Facebook replies took over 12 times longer to arrive at 3318 minutes on average, and only half of those came inside of 48 hours - the most of any segment in any channel across this test.
Instagram was the best performer in this segment due to a strong 86.96% sending a real reply. With 15% of those responses coming in the first 5 minutes and 25% within the first 10, there were some very efficient response times combined with that better response rate. However, with 75% outside of this and an average response time of 2562.2 minutes, there is still much room for improvement on Instagram, where 25% of replies fell outside of the 48 hour window.
"Overall, the Multi-Site Independents segment has immense potential to boost membership sales by optimizing response rates, particularly on social media. While efforts are being made to respond, the critical factor of response speed is often overlooked. Even matching the current level of determination seen in email replies would be a significant improvement, but it still falls short of the ideal 5-minute ‘golden window’ for maximizing engagement and conversions."

Aus Public Leisure
- 12.5%
- Web Chat Availability %
- 70.37%
- % of Recipients Who Sent 'Real' Email Replies
- 29.63%
- % of Recipients Who Didn't Respond to Email
- 468.03
- Avg ‘speed to lead’ for 'real' email replies (mins)
- 47.62%
- % of Instagram Accounts That Sent 'Real' Replies
- 2791.46
- Avg ‘speed to lead’ for 'real' Instagram replies (mins)
- 47.83%
- % of Facebook Accounts That Sent 'Real' Replies
- 1509.18
- Avg ‘speed to lead’ for 'real' Facebook replies (mins)
Summary of Aus Public Leisure Performance
70.37% of Email Recipients sent a 'real' reply
29.63% of Email Recipients did not reply at all
5.26% of Email Recipients who responded did so within the 5 minute 'golden window'*
10.53% of Email Recipients who responded did so within a 10 minute window
7.41% Emails utilised an automated response
10.53% of Email Recipients who responded took more than 24 hours to respond
5.26% of Email Recipients who responded took more than 48 hours to respond
-----------
47.83% of Facebook Recipients sent a 'real' reply
52.17% of Facebook Recipients did not reply at all
69.57% Facebook messages utilised an automated response
9.09% of Facebook Recipients who responded did so within the 5 minute 'golden window'
27.27% of Facebook Recipients who responded did so within a 10 minute window
-----------
47.62% of Instagram Recipients sent a 'real' reply
52.38% of Instagram Recipients did not reply at all
28.57% Instagram messages utilised an automated response
10% of Instagram Recipients who responded did so within the 5 minute 'golden window'
20% of Instagram Recipients who responded did so within a 10 minute window
-----------
Australian Public Leisure email response rate was the lowest of all the segments we looked at in Australia, with a staggering 29.63% going unanswered and only 7.41% receiving automated responses, that did little to improve things. For those who did reply, the speed of the responses didn't do much to make up for this performance with only 5.26% managing it within the 5-minute window and again only 10.23% did so within 10 minutes. Like the Independent Multi-Sites, almost 90% of those that did reply did so under the 24 hour mark, but where they differ, is that after 48 hours 5.26% still went unanswered.
Almost 70% (69.57%) of inquiries through Facebook got a real reply, with 5.05% within the 5-minute window we were looking for and growing to 27.07% within 10 minutes. Again though, this performance is deceptive. Looking at these numbers alone would suggest Facebook is receiving greater attention than email, but when we stand back a little further this is not the reality, with email speed to reply averaging out at 468 minutes, while well over 1000 minutes later one can expect a Facebook response, with the average time to reply of 1509 minutes - more than 24 hours.
The vastly greater use of automated responses at 69.57% may well be creating a false sense of security here, with those messaging this way having technically received a reply, but in no way receiving an answer.
Public Leisure facilities are certainly making themselves available on Instagram, but with fewer than half (47.62%) of messages receiving a real reply, it is clearly not being given the same attention as the other channels, or as much attention as other segments are giving it. With 28.57% of messages receiving automated replies vs 69.57% in Facebook this cohort actually has the second highest utilisation of automated messaging in Instagram, yet it's interesting to note that the sister platforms are treated so differently, despite both having this capability. 'Golden window' responses were similar to Facebook, with Instagram attracting 10% of its real responses in this times, but a lower percentage of 20% were achieved within the 10 minute cut off. The speed to reply was by far the slowest on Instagram at 2791 minutes.
"While Public Leisure’s response times on Instagram were faster than those of Multi-Site Independents, the 2,791 minutes it took to reply is far from speedy. Moreover, Public Leisure lagged behind competing segments in response times on both email and Facebook. There’s clearly significant room for improvement. To optimize strategies, it’s crucial to take social channels more seriously as key communication tools, meeting prospects on their terms. Beyond just responding, the urgency of timely replies must be recognized, measured, and improved to effectively reduce the costs of attracting and converting new members."

Aus Franchise / Corporate Chains
- 14.29%
- Web Chat Availability %
- 83.90%
- % of Recipients Who Sent 'Real' Email Replies
- 16.10%
- % of Recipients Who Didn't Respond to Email
- 488.65
- Avg ‘speed to lead’ for 'real' email replies (mins)
- 73.27%
- % of Instagram Accounts That Sent 'Real' Replies
- 1902.21
- Avg ‘speed to lead’ for 'real' Instagram replies (mins)
- 71.11%
- % of Facebook Accounts That Sent 'Real' Replies
- 976.3
- Avg ‘speed to lead’ for 'real' Facebook replies (mins)
Summary of Aus Franchise / Corporate Chains performance
83.90% of Email Recipients sent a 'real' reply
16.10% of Email Recipients did not reply at all
5.05% of Email Recipients who responded did so within the 5-minute 'golden window'*
11.11% of Email Recipients who responded did so within a 10 minute window
0% Emails utilized an automated response
13.13% of Email Recipients who responded took more than 24 hours to respond
3.03% of Email Recipients who responded took more than 48 hours to respond
-----------
71.11% of Facebook Recipients sent a 'real' reply
28.89% of Facebook Recipients did not reply at all
44.44% Facebook messages utilized an automated response
14.06% of Facebook Recipients who responded did so within the 5-minute 'golden window'
23.44% of Facebook Recipients who responded did so within a 10-minute window
-----------
73.27% of Instagram Recipients sent a 'real' reply
26.73% of Instagram Recipients did not reply at all
9.90% of Instagram messages utilized an automated response
5.41% of Instagram Recipients who responded did so within the 5-minute 'golden window'
13.51% of Instagram Recipients who responded did so within a 10-minute window
-----------
Email responses were considerably stronger in the Aus Franchise / Corporate Chains camp, with 83.90% coming back with a real reply. Interestingly, the rate of quick responses within 5 minutes was similar between Independent Multi-Sites and Public Leisure, at 5.05%. Additionally, 11.11% of responses were made within 10 minutes, showing further alignment between these segments. However, Franchise/Corporate Chains stood out for all the wrong reasons, with the highest percentage of replies taking over 24 hours at 13.13%, and 3.03% of responses took more than 48 hours. Moreover, this cohort had the slowest overall email response time, averaging 488 minutes - making it the only segment we tested to exceed an 8-hour response time.
Interestingly, Facebook performance mirrored email results, with Franchise/Corporate Chains achieving the second-highest response rate in the study, replying to 71.11% of inquiries on this platform. The use of automated responses helped close the gap, with 44.44% of messages receiving an automated reply, leaving only 20% of inquiries without any real or automated response. Notably, 14.06% of Facebook replies were delivered within the first 5 minutes, ranking just behind Multi-Site Independents. Additionally, 23.44% of replies were sent within 10 minutes, closely aligning with the study’s overall average.
At 976 minutes on average to reply to Facebook this was again second best in the study, but this is not to be celebrated when we know 5 minutes to be the optimal window - the bottom line being that of 90 inquiries sent through this channel, over 85% are missing the 21x increased likelihood of a contact become a lead. There is a staggering amount being left on the table in addition to those who received no response.
Instagram performed similarly in terms of response rates, with 73.27% of inquiries receiving a real reply. However, it lagged significantly when it came to quick responses, with only 5.41% replying within 5 minutes and 13.51% within 10 minutes, both well below expectations. The overall average response time of 1,902 minutes is on the higher side of average for those tested, and 70.27% of replies took longer than 24 hours.
"Franchise Instagram results, being on or above the study’s averages, are as surprising as they are disappointing, especially considering this segment had the strongest adoption and visibility on the platform among those tested."

Aus Independent Health Clubs / Gyms
- 13.33%
- Web Chat Availability %
- 90.00%
- % of Recipients Who Sent 'Real' Email Replies
- 10.00%
- % of Recipients Who Didn't Respond to Email
- 426.51
- Avg ‘speed to lead’ for 'real' email replies (mins)
- 82.76%
- % of Instagram Accounts That Sent 'Real' Replies
- 889.26
- Avg ‘speed to lead’ for 'real' Instagram replies (mins)
- 80.00%
- % of Facebook Accounts That Sent 'Real' Replies
- 531.67
- Avg ‘speed to lead’ for 'real' Facebook replies (mins)
Summary of Aus Independent Health Clubs / Gyms performance
90.00% of Email Recipients sent a 'real' reply
10.00% of Email Recipients did not reply at all
3.70% of Email Recipients who responded did so within the 5-minute 'golden window'*
11.11% of Email Recipients who responded did so within a 10-minute window
0.00% of Emails utilized an automated response
11.11% of Email Recipients who responded took more than 24 hours to respond
100% of Email Recipients who responded did so within 48 hours
-----------
80.00% of Facebook Recipients sent a 'real' reply
20.00% of Facebook Recipients did not reply at all
43.33% of Facebook messages utilized an automated response
4.17% of Facebook Recipients who responded did so within the 5-minute 'golden window'
16.67% of Facebook Recipients who responded did so within a 10-minute window
-----------
82.76% of Instagram Recipients sent a 'real' reply
17.24% of Instagram Recipients did not reply at all
6.90% of Instagram messages utilized an automated response
0.00% of Instagram Recipients who responded did so within the 5-minute 'golden window'
4.17% of Instagram Recipients who responded did so within a 10-minute window
-----------
Australia’s Independent Health Clubs/Gyms delivered some of the most varied results in the entire study - a true mixed bag. While their average email response time was a middling 426 minutes, they excelled in the percentage of real replies sent, leading all segments with an impressive 90%. However, they scored the lowest in the golden window test, with just 3.7% of replies coming within the first 5 minutes. On a more positive note, they joined Multi-Site Independents as the only segments to ensure all replies were sent within 48 hours. This consistency in timely responses, coupled with their high reply rate, clearly demonstrates a strong and sustained effort in this channel.
Social media is where this cohort truly excelled. They achieved the highest response rate on Facebook by far, at 80%, compared to the study’s average of 66.46%. They also recorded the shortest average reply time on the platform, clocking in at 531 minutes - a fraction of the time taken by others and nearly half that of the next best segment. However, much like with email, their performance within the first 5 minutes was the lowest at just 4.17%, and they also lagged in 10-minute responses, with only 16.67% compared to the 22.02% average. But stay with me on this rollercoaster - despite these early shortcomings, Independent Health Clubs/Gyms then surpassed all other segments by sending the most replies within the 24- and 48-hour windows. When you consider this in conjunction with their highest overall response rate, it’s clear that their consistent follow-through sets them apart.
Let's take a quick look at Instagram before we consider what that means. You might have guessed it, but Instagram responses follow this same pattern with a high rate of response (the second highest in the study) at 82.8%; average response times are miles out in front at 889 minutes; responses within five minutes are the worst in the group, but responses in 24 and 48 hours are by far the best.
So what does it mean?
With our bird's eye view, it would appear that much of the right stuff is being put into practice here, but I'd argue that despite this they still fall at the last hurdle. It's clear that all channels are receiving attention, and that compared to the others' approach at least - both the need to reply and speed of reply are being taken seriously for social media channels as much as email. This segment seems best at applying resources to these channels. Where I believe they fall short, is that while they're performing best in the right area, I cannot in good conscience suggest that an average response time of 889 minutes on Instagram is in any way optimal. No matter how much faster it is than the 1884-minute average across the study. This cohort feels closest to awareness of where fitness centers can do better, but the opportunity to do more is still clear.
"It’s clear that Australian independent health clubs and gyms are doing many things right, particularly in allocating resources effectively across all channels and recognizing the importance of timely responses. However, despite these efforts, they’re still missing a critical opportunity. An average response time of 889 minutes on Instagram, though faster than the study’s average, is far from optimal. Speed is crucial for capturing and converting leads. While they’re on the right track, there’s still a significant opportunity to improve response times and truly maximize their top-of-the-funnel performance"

Top Of The Funnel Lead Gen Performance
The Importance of Focusing on Member Acquisition
Member acquisition should be a top priority for operators aiming to grow their business. While it’s well-known that retaining existing members is generally more cost-effective than acquiring new ones, the reality is that member acquisition remains essential for sustaining growth. However, because acquiring new members is inherently more expensive, operators must ensure that every dollar spent on this process is used effectively, maximizing returns. This means having tightly controlled responses to every lead and a strategic approach to generating more leads should be a non-negotiable.
To begin with, generating more leads is crucial, but the focus should be on the quality of these leads rather than just the quantity. It’s not enough to simply attract prospects; they need to be well-informed and genuinely interested in what your gym offers, meaning responses to inquiries should be informative and pertinent, but more than this - they should be action-oriented.
By understanding the prospect’s needs and providing them with the right information at the right time, interest can be turned into commitment, ensuring a higher rate of tour attendance. Moreover, better-informed prospects and the higher intent demonstrated by the resulting improvements in tour attendance, directly correlate with higher conversion rates.
By focusing on these aspects of member acquisition, fitness operators can maximize their return on investment (ROI) from ad spend and resource commitment, ultimately leading to a more successful and profitable business.
"Effective member acquisition is not just about generating leads; it’s about attracting high-quality prospects and engaging them with precise, action-driven communication. In a competitive B2C market, particularly in fitness, every touchpoint matters. Operators need to ensure that their responses are not only timely but also tailored to convert interest into commitment. By optimizing these early interactions, we can significantly enhance conversion rates and maximize ROI from acquisition efforts, turning top-of-the-funnel leads into loyal members.”

Lowering Cost Per Lead and Cost Per Acquisition
Optimizing the entire member acquisition process - from generating high-quality leads to ensuring tour attendance, can significantly lower your Cost Per Lead (CPL) and Cost Per Acquisition (CPA). When your marketing and sales strategies are fine-tuned to attract, engage, and convert the right prospects efficiently, the overall cost of acquiring new members decreases. This optimization doesn’t just enhance the effectiveness of your current spending; it also reduces the amount of resources and ad spend required to maintain or even grow your membership base.
Lowering CPL and CPA has a direct impact on your gym’s profitability. When you spend less to acquire each new member, the margin between the revenue generated from memberships and the cost of acquiring those members widens, leading to higher profit margins.
In essence, optimizing for high-quality leads, maintaining strong engagement throughout the prospect journey, and ensuring high conversion rates means that with the right strategies and tools in place, acquiring new members becomes a highly profitable endeavor - driving long-term success for your fitness business.
Here’s why:
1. High-Quality Leads: By focusing on attracting leads that are more likely to convert, you reduce wasted spend on prospects who are less likely to become members. This naturally lowers your CPL as you’re spending your marketing budget more efficiently.
2. Efficient Engagement: Engaging leads effectively throughout their journey ensures that more of them progress toward membership. This increases your conversion rate, which directly impacts your CPA. The more leads you convert for the same or lower spend, the lower your CPA will be.
3. Resource Allocation: Optimizing these processes means you’re making better use of your resources, whether that’s your marketing budget, your sales team’s time, or your CRM tools. This reduces the need for excessive ad spend or additional resources to achieve your growth targets.
4. Profit Margins: Lowering CPL and CPA directly increases profitability because the gap between the revenue generated by each new member and the cost to acquire them widens. The lower your acquisition costs, the higher your profit margins, assuming your membership pricing and retention strategies remain effective.
The Way Forward
In today’s digital world, people expect quick responses and efficient service more than ever. If our study has proven anything it's that gyms and fitness centers often struggle to keep up with these expectations.
Delays in replying to inquiries, whatever the channel, stifle facilities' performance when it comes to tour attendance and conversion and add needless bulk to the costs of acquiring leads and members. These delays need to be seen for their hemorrhaging effects on profits.
That’s why we created the Keepme Antares, a game-changer designed to transform how fitness centers engage with potential members.
Meet Keepme's AI Sales Agents
✅ Engagement Across All Channels
Our AI Sales Agents make sure no inquiry goes unanswered, no matter where it comes from. Whether it’s a voice call, email, social media message, web chat, or WhatsApp, our AI is always ready to engage. This means your fitness center can connect with prospects at their peak interest times
✅ Always On, Always Available
Unlike human staff, who need breaks and days off, Antares' AI agents work 24/7, 365 days a year. This ensures that all inquiries are handled promptly, reducing wait times and making sure no potential member is missed. Plus, our AI can manage unlimited inquiries simultaneously, allowing your gym to grow without the need for extra hiring.
✅ Enhancing the Customer Journey
According to Akeneo, a significant 66% of consumers are now spending more time researching and validating their purchases because of the cost-of-living crisis, with 63% saying they would abandon a brand if they had a negative experience with their product information. So making sure your info is always on-brand, being conveyed accurately, and with the immediacy prospects expect is crucial.
Keepme AI Sales Agents are designed to improve every interaction with your prospects. From booking tours and free trials to answering detailed questions about your facilities, our Agents make sure every interaction is timely and meaningful.
With Keepme AI Sales Agent, you can meet the high expectations of today’s consumers, providing instant, efficient, and high-quality service at all times. Transform your fitness business and never miss an opportunity to engage with potential members.

Revolutionise Your Fitness Business with AI-Powered Sales Agents 🚀
Keepme Antares is set to transform how you engage with your club's prospects, ensuring you never miss an opportunity to turn them into members.
The Study Methodology
For the avoidance of doubt and to provide the fairest chance for clubs to respond to our membership inquiries, we sent all of our messages and emails between 8am and 6pm on weekdays.
Definitions:
'Automated responses' are those that were received immediately on our membership enquiries being sent
'Real responses' are those where a human member of a sales team has read the inquiry and appropriately responded with the required information
Emails
We wrote to 202 addresses with the following level of intent asking for membership information:
Instagram and Facebook
We sent this message or others very similar to it using the message function provided in Instagram and Facebook accounts.
-1722584700.png)


.png)
